| z-Scores |
|---|
|
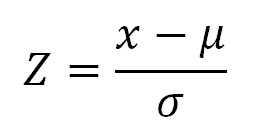
z-Scores are standardized values that can be used to compare scores in different distributions. |
Take this example: For the past two years, Joe has been in a bowling league.
First Year Stats:
League Average = 181
Standard Deviation = 12
Joe’s Score in Final Game = 187
Second Year Stats:
League Average = 182
Standard Deviation = 5
Joe’s Score in Final Game = 185
Compared to the rest of the league, in which year was Joe’s score in the final game better?

|
Figure 1. |
|---|
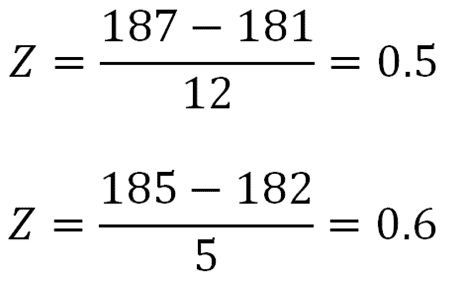
We can calculate a z-score for each year:

|
Figure 2. |
|---|
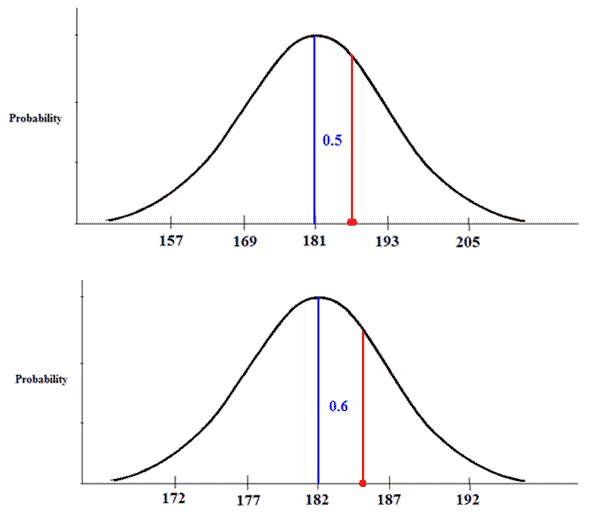
We can then plot the z-scores and compare their placement on the distribution. From the graphs below you can see that compared to the rest of the league, Joe had a better score in his second year.

|
Figure 3. |
|---|