Quadratic Inequalities are graphed much like regular inequalities.

|
Figure 1. |
|---|
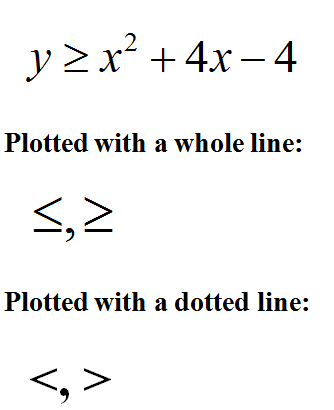
Above is a quadratic inequality. Much like regular inequalities, "Less Than or Equal To" and "Greater Than or Equal To" signs are plotted using a whole line, while "Less Than" or "Greater Than" signs are plotted using a dotted line.

|
Figure 2. |
|---|
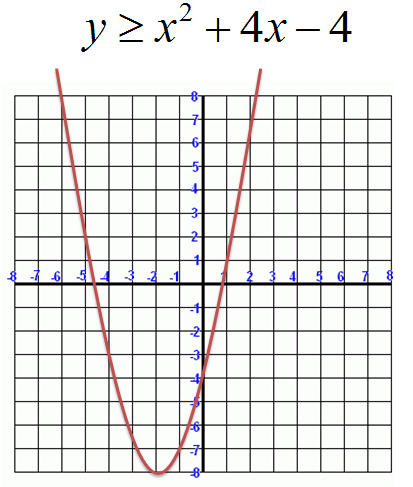
Our quadratic inequality is graphed above.
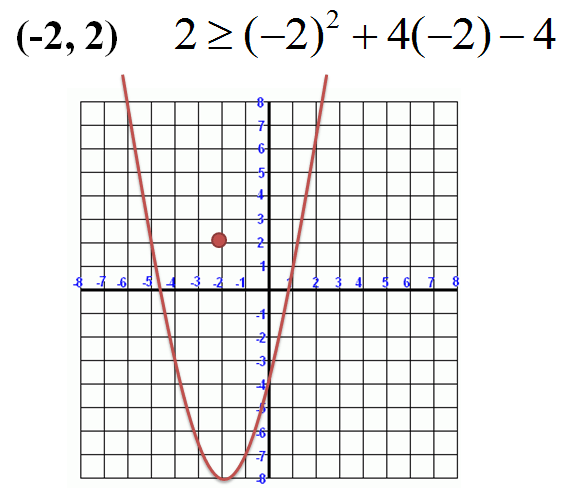
To check which area of the graph we need to shade, we select a point on the graph. If the point is a valid solution, we shade the area that contains the point. If it isn't a valid solid, we shade the area that doesn't contain the point.

|
Figure 3. |
|---|
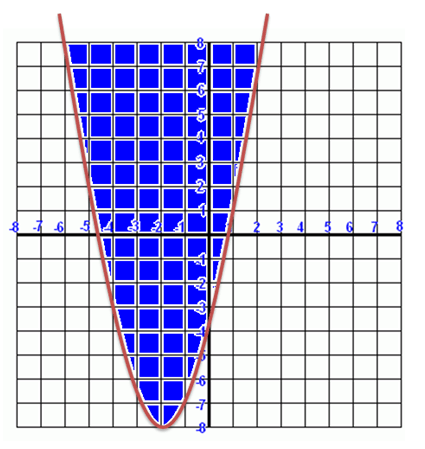
(-2, 2) is a valid solution, so we shade the inner portion of the parabola.

|
Figure 4. |
|---|