| Frequency Distribution |
|---|
|
A frequency distribution lists all possible outcomes of an event, and the number of times each event occurs. |
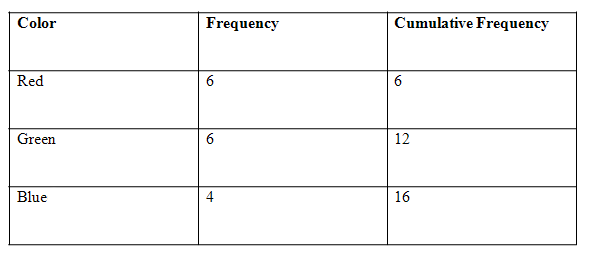
Imagine that you reached into a bag of candy 16 times and pulled out the following colors of candy:
Red, Green, Green, Green, Blue, Blue, Red, Blue, Green, Green, Red, Red, Blue, Green, Red, Red
Record your results in a frequency distribution table.
A cumulative frequency table for the data would look like this:
|
Figure 1. |
|---|


 Facebook
 YouTube


 Home
Home
 Calculators
 Tutoring